The Ethics in Visual Thinking panel discussion at VizThink 2008 touched on how visualizations can have an influence on people’s perceptions about the topics they are communicating. What visual thinkers choose to include, what they choose to exclude, and how they choose to represent a topic all can cause wild swings in people’s opinions. A few examples shown by the panel:
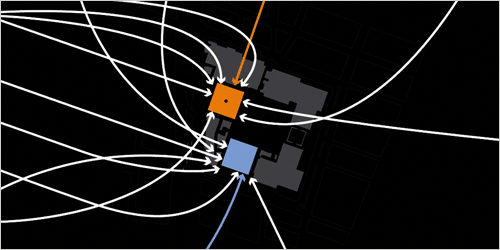
This composite illustration depicts how only one newspaper publication visualization (the colored lines) accurately depicted the flight path of the planes involved in the 911 tragedy. Examples of the inaccurate visualizations can be found on the VizThink site.
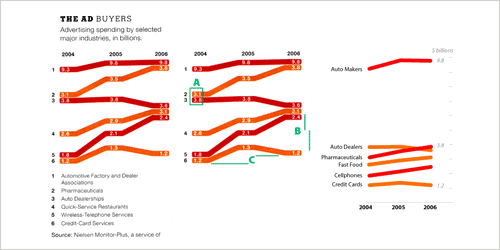
In this New York Times chart, the green lines represent data issues and the image on the far right shows how the chart should be designed.
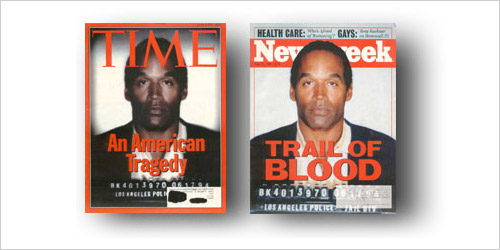
The depiction of OJ Simpson on the cover of Time questions the neutrality of the magazine on OJ’s innocence.
This sleek rendering of weapons used by the military raises concerns that war is being presented in a shiny or fun manner.


