A recurring theme at this year’s SIGGRAPH conference was the use of metaphors for information visualization. Two projects in particular, addressed the overabundance of digital information we currently face by using familiar “real-world” concepts to introduce chance and enjoyment to data analysis. These projects acknowledge that our experience with information can be ephemeral.
 “MIT Media Lab’s Artifacts of the Presence Era uses a geological metaphor to create an impressionistic visualization of the evolving history in a museum’s gallery. The piece captures people’s presence in the galleries: the images and sounds of visitors as they move through the museum. People’s rhythms and activities in this public space become the accumulating layers in a growing landscape of past events."
"We designed the piece so that visitors could move through the layers of the history, behaving like archaeologists, ‘excavating’ the traces left in the visualization to get a sense of how the space had been used over time. The piece invites people to more deeply consider the temporal patterns and aesthetic beauty present in the data that are around us. Its algorithms were meant to be more like the erosion forces that shape the geological record than the carefully calibrated heuristics of a semantically based compression tool.”
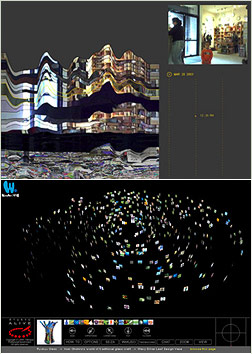
“Ryukyu ALIVE is an information visualization system of the huge Web Archives named ‘Wonder Okinawa.’ This system renders the total contents of the digital archive in a 3D space. Up-to-minute access to the archive is dynamically visualized by analyzing a user’s access log. By using the metaphor of galaxy, a variety of interactions and visualizations are realized.
The galactic space of Ryukyu ALIVE is constructed as a concentration of many stars (icons). Each icon represents a separate Web page in the digital archives. When a user accesses a certain Web page, the corresponding icon pops out to the outermost circle of the galaxy. Icons of pages with little access will be drawn gradually into the center of the galaxy, and will eventually be absorbed and become invisible. Fluctuation of the galaxy by icon pop-out and absorption represents overall status of the digital archives. The movement of the icons is reflected to the galaxy by analyzing accesses to the Web server 15 minutes before.”